记一次平平无奇的数据挖掘课的作业。
顺便练习使用markdown语法。
作业题:
第五章
第一题
决策树是一种很常见的机器学习方法。常常用在样本的对象和属性值一一对应时;目标函数有离散的输出值;可能需要析取假设;训练数据集中可能有噪声或者样本中含有缺失属性值的情况下。
第二题
剪枝处理是决策树学习算法解决过拟合的主要手段。决策树剪枝的基本策略可分为预剪枝和后剪枝。
预剪枝是指在决策树生成的过程中,对每个结点在划分前进行估计,若当前节点的划分不能带来决策树泛化性能的提升,则停止划分并将当前节点标记为叶结点。
后剪枝则是先从训练集生成一颗完整的决策树,然后自底向上的对非叶结点进行考察。若当前结点对应的子树替换为叶结点能带来决策树泛化性能的提升,则将该子节点替换为叶结点。
第三题
缺失值将从三个方向给决策树的构建带来影响:
- 在训练样本属性缺失的情况下,无法进行划分属性的选择
- 给定划分属性,若样本在该属性上的值是缺失的,导致无法对此样本进行划分
- 测试样本中属性有缺失值,可能导致测试出错
第四题
优点
- 决策树学习为概念学习和其他离散值函数的学习提供了一种可供实践的方法。
- 具有可解释性,能够在相当短的时间内对大型的数据源做出可行且效果良好的结果,决策树分类的效率高。只需要进行一次构建,即可反复使用。
- 易于通过静态测试来对模型进行评测,可以测定模型可信度;如果给定一个观察的模型,那么根据所产生的决策树很容易推出相应的逻辑表达式。
分类过程中可能出现的问题
- 在决策树分类的过程中,很经常出现的一个问题就是过拟合问题。在决策树构建的过程中,为了尽可能正确的分类学习样本,常常会不断地对结点进行划分,导致决策树的分支过多,可能会导致错误的将样本集的一些特征当作所有数据都具有的特征从而出现过拟合问题。
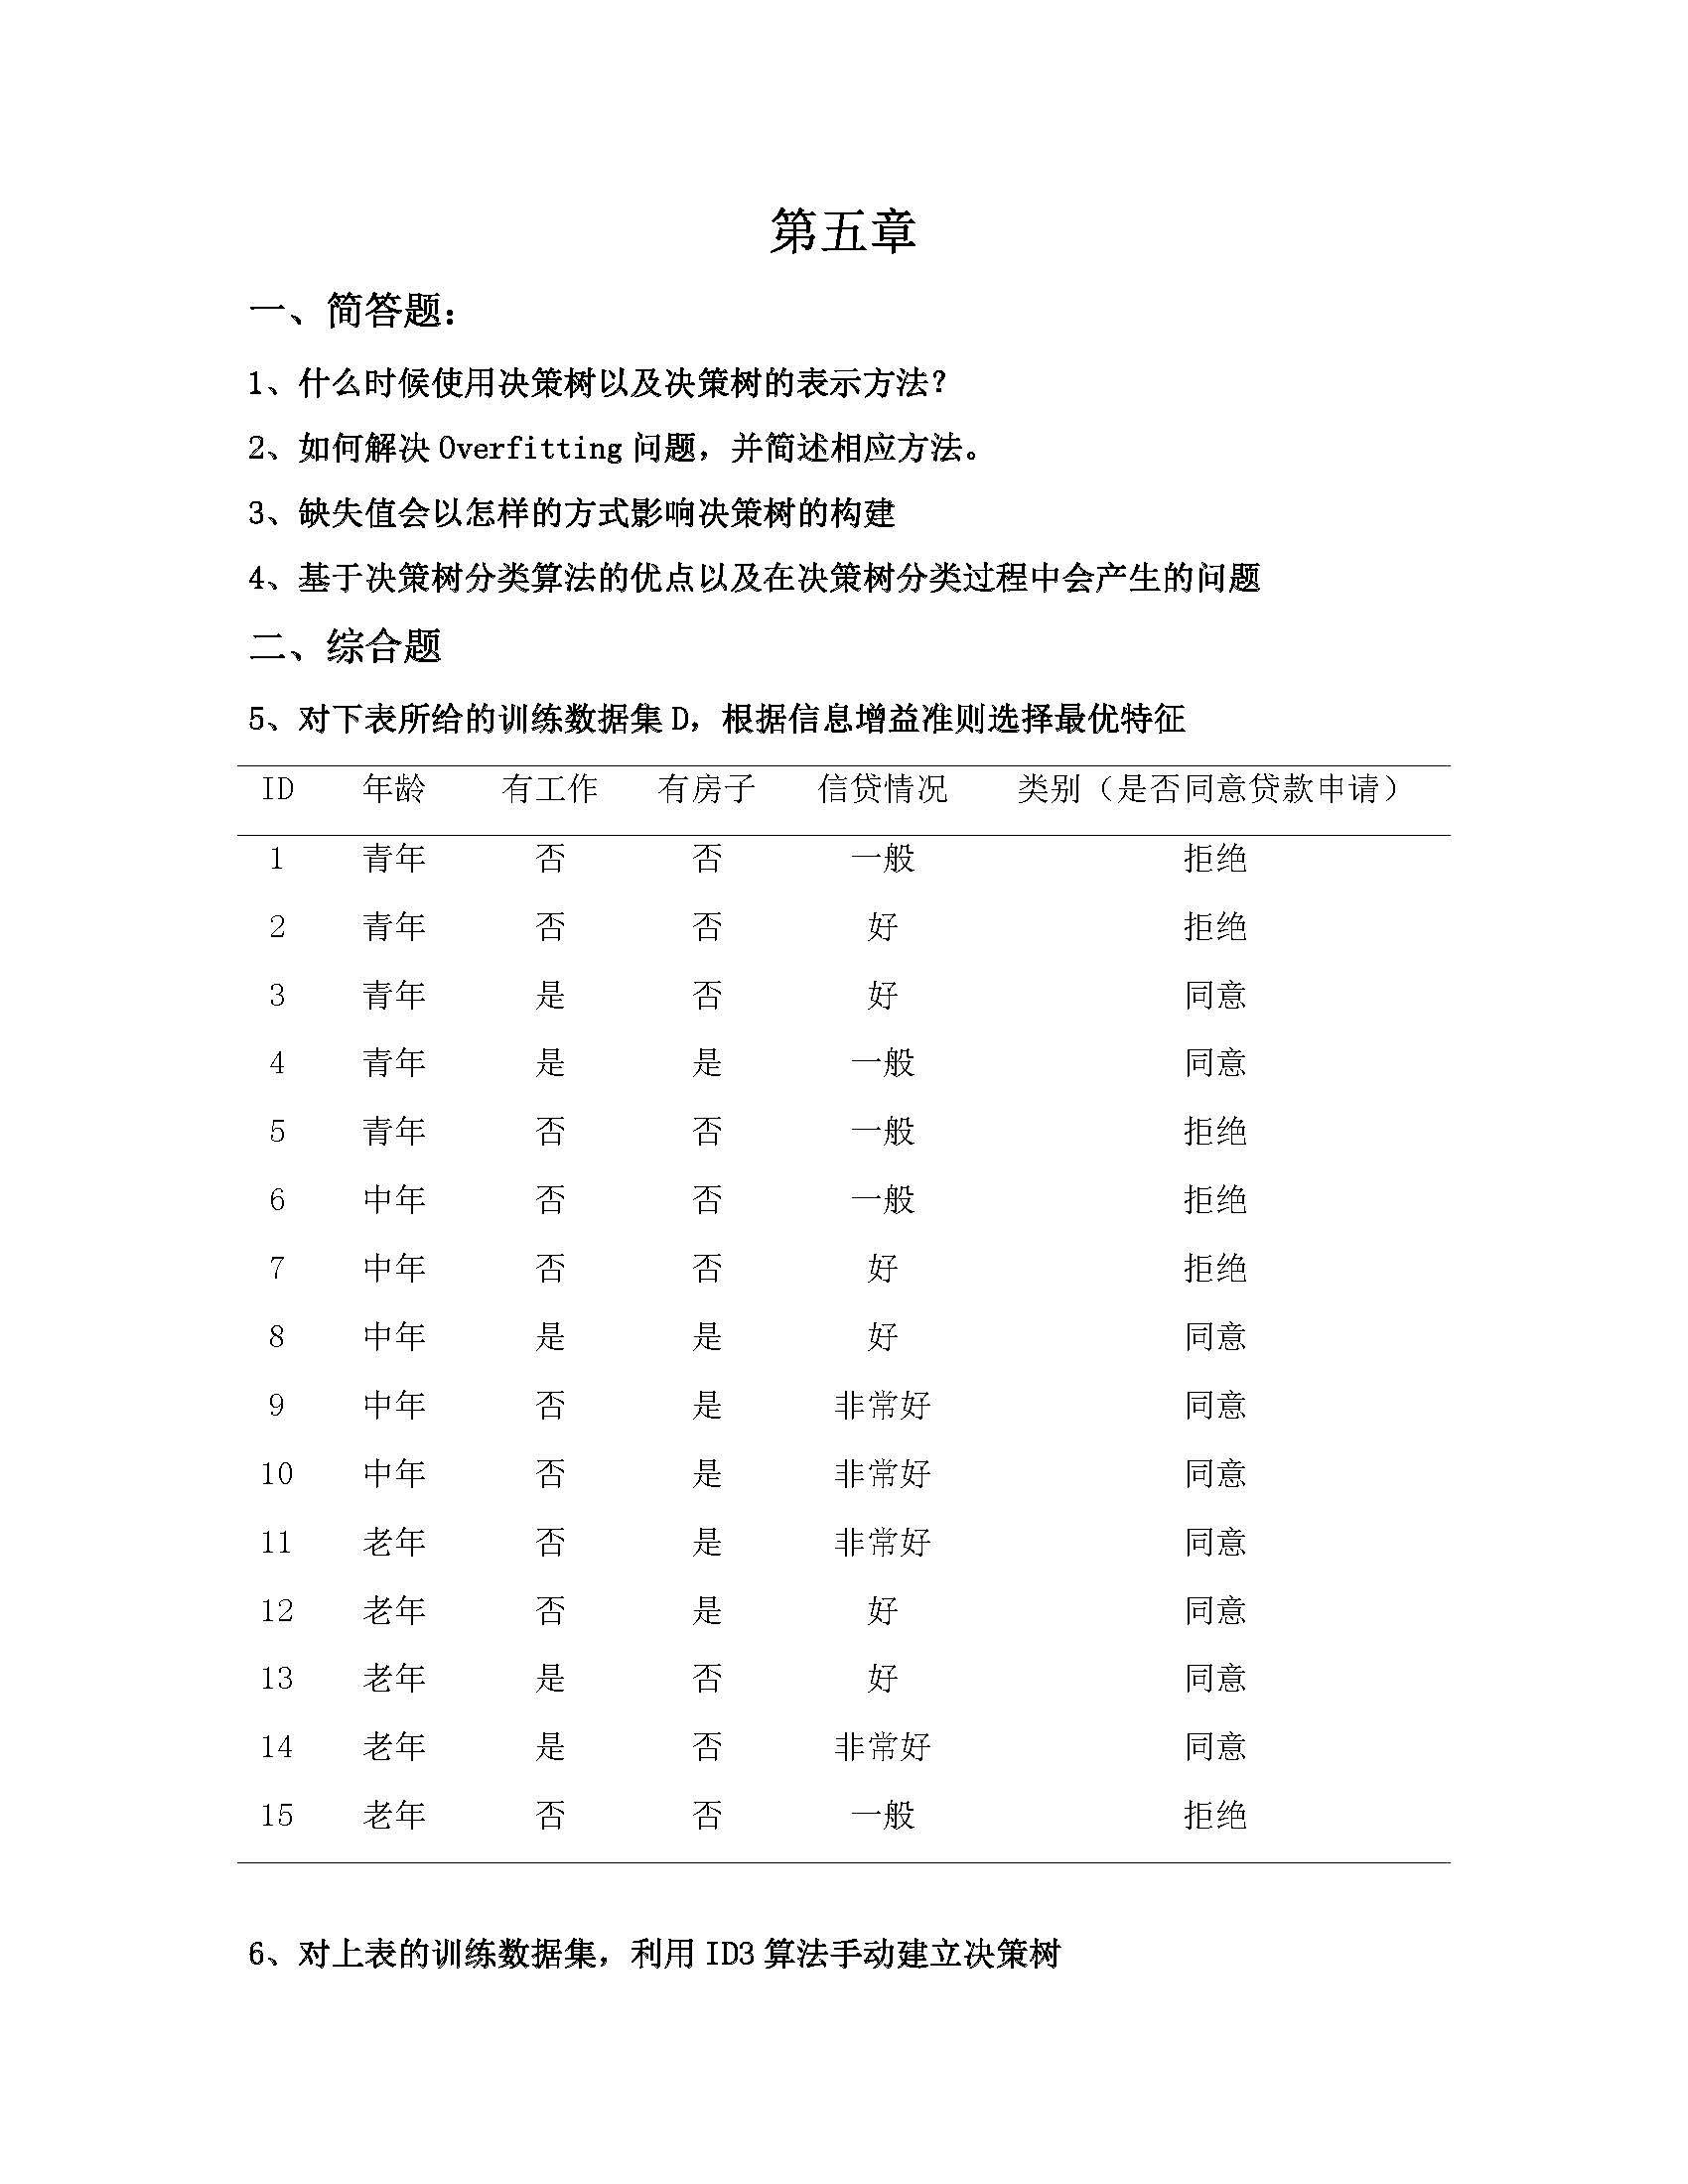
第五题
集合中共含有十五个样本,其中6个拒绝,9个接受,计算集合的信息熵:
以属性“年龄”对集合进行划分,得到三个子集:$D^1(年龄=青年),D^2(年龄=中年),D^3(年龄=老年)$,分别计算三个子集的信息熵:
由信息增益的计算公式,计算属性年龄对样本集$D$进行划分的信息增益:
相似的,分别求取以工作情况划分样本集时,以房产情况划分样本集时,以信贷情况划分样本集时的信息增益:
比较可得,房产情况为最优特征。
第六题
由上文第五题的求解,确定使用房产情况为根结点;
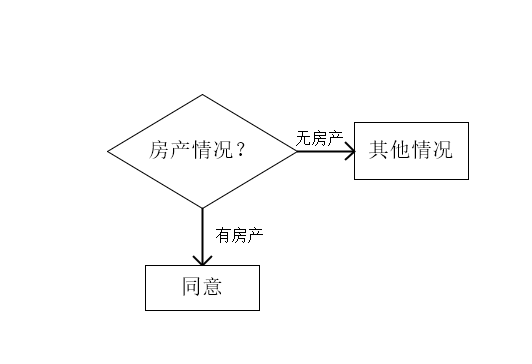
此时,有房产的样本已经到达叶节点;将无房产的样本单独划分为一个集合,共有九个样本,首先计算该子样本集的信息熵:
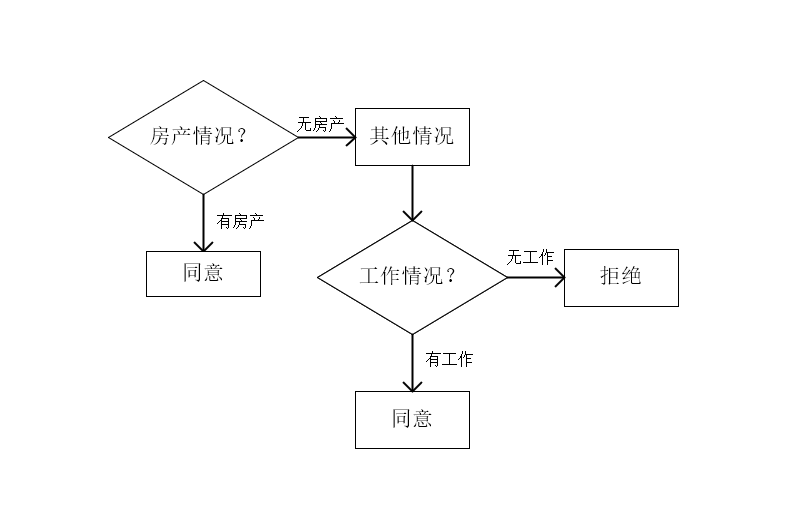
分别计算其他属性对于子样本集的信息增益:
此时:工作情况为最优特征,决策树构建为;
第七题
python源代码:
#ID3算法
import math
import matplotlib.pyplot as plt
from matplotlib.pylab import *

from treePlotter import createPlot

def calcShannonent(dataset):#计算信息熵
    numEntries=len(dataset)
    labelCounts={}
    for featVec in dataset:
        currentLabel = featVec[-1]
        #判断这个标签在字典中是否存在,不存在就初始化
        if currentLabel not in labelCounts.keys():
            labelCounts[currentLabel] = 0
        #统计不同类别的数量
        labelCounts[currentLabel] += 1
    #初始化熵
    shannonent = 0.0
    #计算熵
    for key in labelCounts:
        prob = float(labelCounts[key])/numEntries
        shannonent -= prob * math.log(prob,2)
    return shannonent
def SubDataset(dataset,index,value):#从总的数据集中选取出关心的数据组成新的数据集
    sub_dataset = []
    for example in dataset:
        current_list = []
        if example[index] == value:
            current_list = example[:index]
            current_list.extend(example[index + 1 :])
            sub_dataset.append(current_list)
    return sub_dataset
def ChooseBestFeature(dataset):#选择最优特征
    num_features=len(dataset[0])-1
    current_Ent=calcShannonent(dataset)
    bestFeatureGain=0.0
    bestFeatureIndex=-1
    for i in range(num_features):
        values_features=[example[i] for example in dataset]
        unique_value=set(values_features)
        new_ent=0.0
        Gain=0.0
        for value in unique_value:
            sub_dataset=SubDataset(dataset,i,value)
            p=len(sub_dataset)/len(dataset)
            new_ent +=p*calcShannonent(sub_dataset)
            Gain=calcShannonent(dataset)-new_ent
        if(Gain>bestFeatureGain):
            bestFeatureGain=Gain
            bestFeatureIndex=i
    return bestFeatureIndex

    return
def TreeGenerate(dataset,feature):#通过递归调用创建决策树
    label_list=[example[-1] for example in dataset]

    if(label_list.count(label_list[0])==len(label_list)):#设置递归结束条件,类别中所有的标签都相同时,递归结束,返回一个叶节点
        return label_list[0]

    best_index=ChooseBestFeature(dataset)
    best_feature=feature[best_index]

    decisionTree={best_feature:{}}

    del(feature[best_index])

    values_best_feature=[example[best_index] for example in dataset]
    dict_value=set(values_best_feature)
    for value in dict_value:
        new_feature=feature

        decisionTree[best_feature][value]=TreeGenerate(SubDataset(dataset,best_index,value),new_feature)#递归调用自身不断生成子树

    return decisionTree
def GenerateDataset():
    dataset = [['青年', '否', '否', '一般般', '拒绝'],
               ['青年', '否', '否', '好', '拒绝'],
               ['青年', '是', '否', '好', '同意'],
               ['青年', '是', '是', '一般般', '同意'],
               ['青年', '否', '否', '一般般', '拒绝'],
               ['中年', '否', '否', '一般般', '拒绝'],
               ['中年', '否', '否', '好', '拒绝'],
               ['中年', '是', '是', '好', '同意'],
               ['中年', '否', '是', '非常好', '同意'],
               ['中年', '否', '是', '非常好', '同意'],
               ['老年', '否', '是', '非常好', '同意'],
               ['老年', '否', '是', '好', '同意'],
               ['老年', '是', '否', '好', '同意'],
               ['老年', '是', '否', '非常好', '同意'],
               ['老年', '否', '否', '一般般', '拒绝']]
    features = ['年龄', '有工作', '有房子', '信贷情况']
    return dataset, features


if __name__=='__main__':
    dataset,feature=GenerateDataset()
    decision_tree=TreeGenerate(dataset,feature)

    print(decision_tree)
    # 定义文本框和箭头格式
    decisionNode = dict(boxstyle="round4", color='#3366FF')  #定义判断结点形态
    leafNode = dict(boxstyle="circle", color='#FF6633')  #定义叶结点形态
    arrow_args = dict(arrowstyle="<-", color='g')  #定义箭头
    mpl.rcParams['font.sans-serif'] = ['SimHei']  # 指定默认字体
    mpl.rcParams['axes.unicode_minus'] = False  # 解决保存图像时负号'-'显示为方块的问题

    createPlot(decision_tree)
#绘制决策树
import matplotlib.pyplot as plt


# 定义文本框和箭头格式
decisionNode = dict(boxstyle="round4", color='#3366FF')  #定义判断结点形态
leafNode = dict(boxstyle="circle", color='#FF6633')  #定义叶结点形态
arrow_args = dict(arrowstyle="<-", color='g')  #定义箭头

#绘制带箭头的注释
def plotNode(nodeTxt, centerPt, parentPt, nodeType):
    createPlot.ax1.annotate(nodeTxt, xy=parentPt, xycoords='axes fraction',
                            xytext=centerPt, textcoords='axes fraction',
                            va="center", ha="center", bbox=nodeType, arrowprops=arrow_args)


#计算叶结点数
def getNumLeafs(myTree):
    numLeafs = 0
    firstStr = list(myTree.keys())[0]
    secondDict = myTree[firstStr]
    for key in secondDict.keys():
        if type(secondDict[key]).__name__ == 'dict':
            numLeafs += getNumLeafs(secondDict[key])
        else:
            numLeafs += 1
    return numLeafs


#计算树的层数
def getTreeDepth(myTree):
    maxDepth = 0
    firstStr = list(myTree.keys())[0]
    secondDict = myTree[firstStr]
    for key in secondDict.keys():
        if type(secondDict[key]).__name__ == 'dict':
            thisDepth = 1 + getTreeDepth(secondDict[key])
        else:
            thisDepth = 1
        if thisDepth > maxDepth:
            maxDepth = thisDepth
    return maxDepth


#在父子结点间填充文本信息
def plotMidText(cntrPt, parentPt, txtString):
    xMid = (parentPt[0] - cntrPt[0]) / 2.0 + cntrPt[0]
    yMid = (parentPt[1] - cntrPt[1]) / 2.0 + cntrPt[1]
    createPlot.ax1.text(xMid, yMid, txtString, va="center", ha="center", rotation=30)


def plotTree(myTree, parentPt, nodeTxt):
    numLeafs = getNumLeafs(myTree)
    depth = getTreeDepth(myTree)
    firstStr = list(myTree.keys())[0]
    cntrPt = (plotTree.xOff + (1.0 + float(numLeafs)) / 2.0 / plotTree.totalW, plotTree.yOff)
    plotMidText(cntrPt, parentPt, nodeTxt)  #在父子结点间填充文本信息
    plotNode(firstStr, cntrPt, parentPt, decisionNode)  #绘制带箭头的注释
    secondDict = myTree[firstStr]
    plotTree.yOff = plotTree.yOff - 1.0 / plotTree.totalD
    for key in secondDict.keys():
        if type(secondDict[key]).__name__ == 'dict':
            plotTree(secondDict[key], cntrPt, str(key))
        else:
            plotTree.xOff = plotTree.xOff + 1.0 / plotTree.totalW
            plotNode(secondDict[key], (plotTree.xOff, plotTree.yOff), cntrPt, leafNode)
            plotMidText((plotTree.xOff, plotTree.yOff), cntrPt, str(key))
    plotTree.yOff = plotTree.yOff + 1.0 / plotTree.totalD


def createPlot(inTree):
    fig = plt.figure(1, facecolor='white')
    fig.clf()
    axprops = dict(xticks=[], yticks=[])
    createPlot.ax1 = plt.subplot(111, frameon=False, **axprops)
    plotTree.totalW = float(getNumLeafs(inTree))
    plotTree.totalD = float(getTreeDepth(inTree))
    plotTree.xOff = -0.5 / plotTree.totalW
    plotTree.yOff = 1.0
    plotTree(inTree, (0.5, 1.0), '')
    plt.show()
第八题
python源代码:
#相较于ID3算法,CART算法并无本质上的区别,只是将选择最优特征的根据改为基尼系数
#因此,修改原ID3算法中的计算信息熵函数为计算基尼系数函数,并同步修改选择最优特征函数即可
import math
import matplotlib.pyplot as plt
from matplotlib.pylab import *

from treePlotter import createPlot

def calcGini(dataSet):
    numEntries = len(dataSet)
    labelCounts ={}

    for featVec in dataSet:
        currentLabel = featVec[-1]
        if currentLabel not in labelCounts.keys():
            labelCounts[currentLabel] =0
        labelCounts[currentLabel]+=1
    Gini =1.0
    for key in labelCounts:
        prob = float(labelCounts[key])/numEntries
        Gini -= prob * prob
    return Gini


def SubDataset(dataset,index,value):#从总的数据集中选取出关心的数据组成新的数据集
    sub_dataset = []
    for example in dataset:
        current_list = []
        if example[index] == value:
            current_list = example[:index]
            current_list.extend(example[index + 1 :])
            sub_dataset.append(current_list)
    return sub_dataset
def splitOtherDataSetByValue(dataSet, index, value):
    retDataSet = []
    for featVec in dataSet:
        if featVec[index] != value:
            reduceFeatVec = featVec[:index]  # 删除这一维特征
            reduceFeatVec.extend(featVec[index + 1:])
            retDataSet.append(reduceFeatVec)
    return retDataSet
def ChooseBestFeature(dataSet):
    numFeatures = len(dataSet[0]) -1
    bestGiniIndex = 1000000.0
    bestSplictValue =[]
    bestFeature = -1
    # 计算Gini指数
    for i in range(numFeatures):
        featList = [example[i] for example in dataSet]

        uniqueVals = set(featList)
        bestGiniCut = 1000000.0
        bestGiniCutValue =[]
        Gini_value =0.0

        for value in uniqueVals:

            subDataSet = SubDataset(dataSet,i,value)
            prob = len(subDataSet) / float(len(dataSet))
            Gini_value = prob * calcGini(subDataSet)

            otherDataSet = splitOtherDataSetByValue(dataSet,i,value)
            prob = len(otherDataSet) / float(len(dataSet))
            Gini_value = Gini_value + prob * calcGini(otherDataSet)

            if Gini_value < bestGiniCut:
                bestGiniCut = Gini_value
                bestGiniCutValue = value


        GiniIndex = bestGiniCut
        if GiniIndex < bestGiniIndex:
            bestGiniIndex = GiniIndex
            bestSplictValue = bestGiniCutValue
            bestFeature = i
            #print(bestFeature,bestSplictValue)

    return bestFeature

def TreeGenerate(dataset,feature):#通过递归调用创建决策树
    label_list=[example[-1] for example in dataset]

    if(label_list.count(label_list[0])==len(label_list)):#设置递归结束条件,类别中所有的标签都相同时,递归结束,返回一个叶节点
        return label_list[0]


    best_index=ChooseBestFeature(dataset)
    best_feature=feature[best_index]

    decisionTree={best_feature:{}}

    del(feature[best_index])

    values_best_feature=[example[best_index] for example in dataset]
    dict_value=set(values_best_feature)
    for value in dict_value:
        new_feature=feature[:]

        decisionTree[best_feature][value]=TreeGenerate(SubDataset(dataset,best_index,value),new_feature)#递归调用自身不断生成子树


    return decisionTree
def GenerateDataset():
    dataset = [['青年', '否', '否', '一般般', '拒绝'],
               ['青年', '否', '否', '好', '拒绝'],
               ['青年', '是', '否', '好', '同意'],
               ['青年', '是', '是', '一般般', '同意'],
               ['青年', '否', '否', '一般般', '拒绝'],
               ['中年', '否', '否', '一般般', '拒绝'],
               ['中年', '否', '否', '好', '拒绝'],
               ['中年', '是', '是', '好', '同意'],
               ['中年', '否', '是', '非常好', '同意'],
               ['中年', '否', '是', '非常好', '同意'],
               ['老年', '否', '是', '非常好', '同意'],
               ['老年', '否', '是', '好', '同意'],
               ['老年', '是', '否', '好', '同意'],
               ['老年', '是', '否', '非常好', '同意'],
               ['老年', '否', '否', '一般般', '拒绝']]
    features = ['年龄', '有工作', '有房子', '信贷情况']
    return dataset, features


if __name__=='__main__':

    dataset,feature=GenerateDataset()
    decision_tree=TreeGenerate(dataset,feature)

    print(decision_tree)
    # 定义文本框和箭头格式
    decisionNode = dict(boxstyle="round4", color='#3366FF')  #定义判断结点形态
    leafNode = dict(boxstyle="circle", color='#FF6633')  #定义叶结点形态
    arrow_args = dict(arrowstyle="<-", color='g')  #定义箭头
    mpl.rcParams['font.sans-serif'] = ['SimHei']  # 指定默认字体
    mpl.rcParams['axes.unicode_minus'] = False  # 解决保存图像时负号'-'显示为方块的问题

    createPlot(decision_tree)
第六章
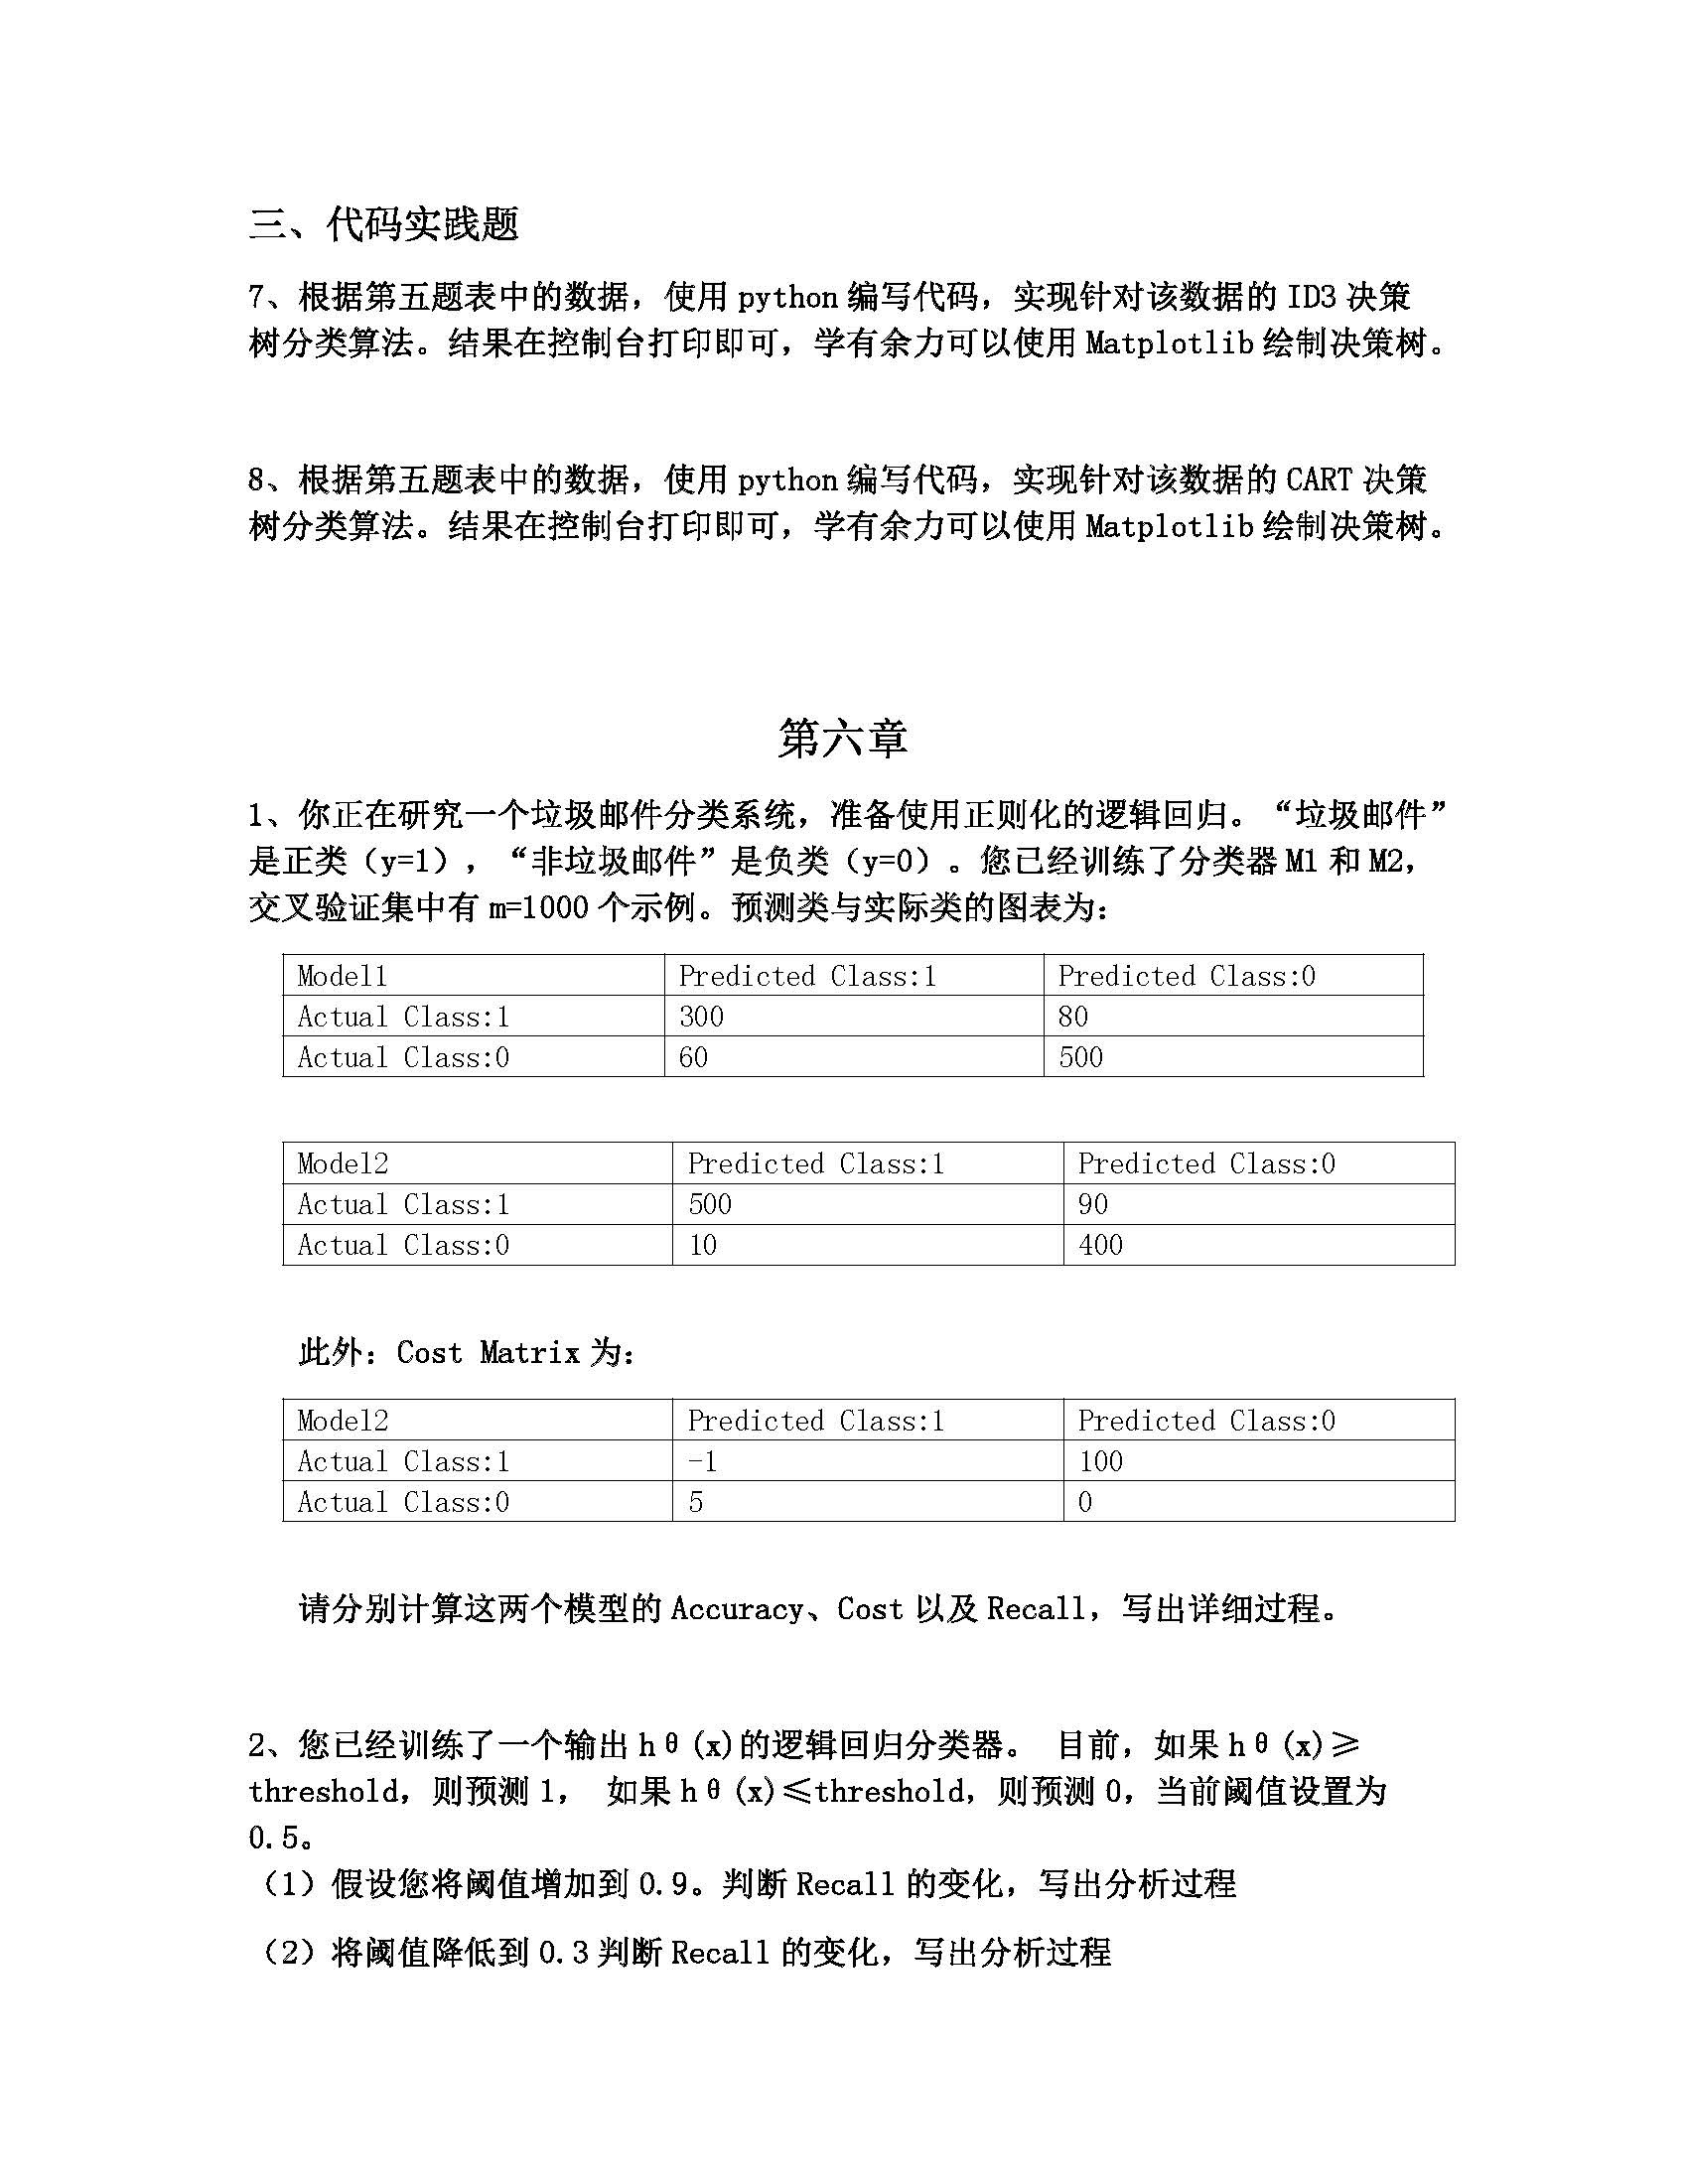
第一题
- Model1
- Model2
第二题
- 1、当阈值增大时,样本中实际为正值的样本的个数不变,但是由于阈值的提高,可能导致一部分正例可能被误判为负例,即$TP+FN$的值不变,而$TP$的值可能变小,$Recall=\frac{TP}{TP+FN}$,所以,recall的值将可能不变或变小。
- 2、当阈值减小时,样本中实际为正值的样本的个数不变,但是由于阈值的减小,可能导致一部分本来被误判的正例被正确的判为正例,即$TP+FN$的值不变,而$TP$的值可能变大,$Recall=\frac{TP}{TP+FN}$,所以,recall的值将可能不变或变大。
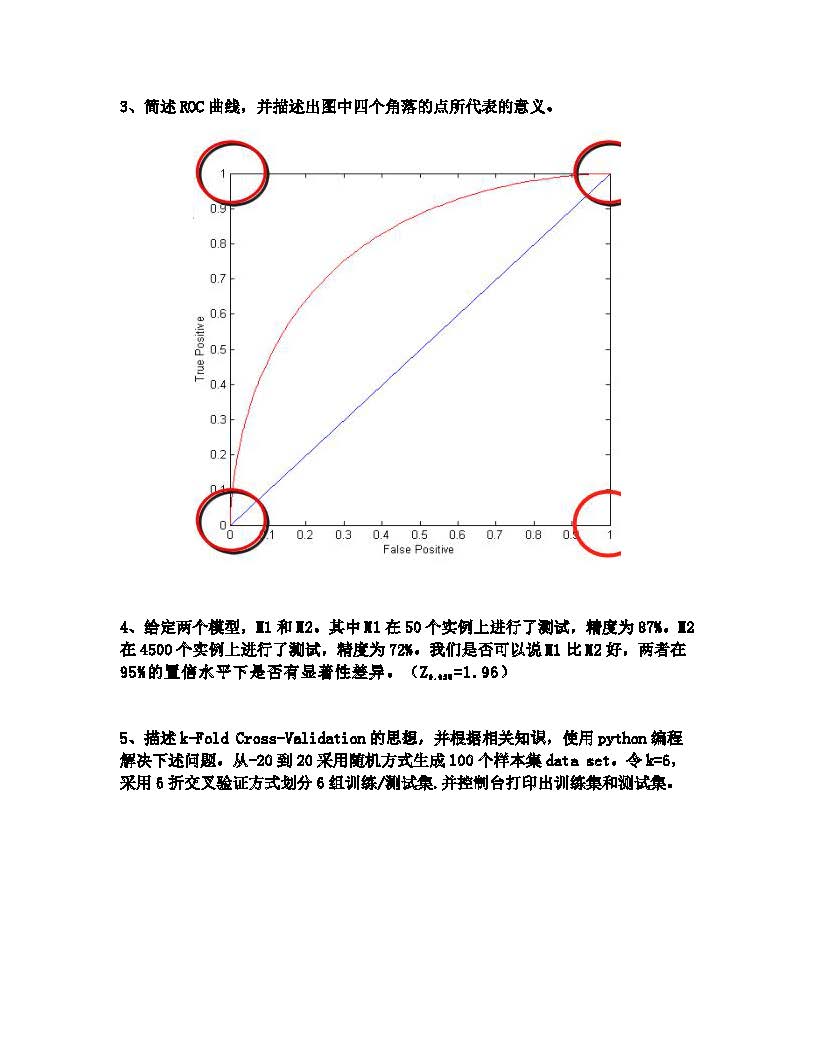
第三题
ROC曲线即受试者工作特征曲线,其纵轴为TPR(True Positive Rate),横轴为FPR(False Positive Rate):
在ROC曲线中的每一个点都代表了一个分类器,而这个点的横纵坐标代表了这个分类器的性能。改变分类器的阈值,分类器所代表的点也在ROC曲线上移动。
ROC曲线的四个顶点$(0,0),(0,1),(1,0),(0,0)$;每个点都有特殊的含义:
- $(0,0)$点:即$FPR=TPR=0$,即$FP=TP=0$,可以发现该分类器预测所有的样本都为负样本;
- $(0,1)$点:即$FPR=0,TPR=1$,即$TP=TP+FN,FN=FP=0$,且该分类器全部判断正确,是一种理想的分类器;
- $(1,0)$点:即$FPR=1,TPR=0$,即$FP=FP+TN,TP=TN=0$,该分类器是最糟糕的分类器,所有的预测都是错误的;
- $(1,1)$点:即$FPR=TPR=1$,$TN=FN=0$,可以发现,该分类器判断所有的样本都是正样本。
第四题
$M_1$模型在大小为50的集合上进行测试,错误率$e_1=0.13$;
$M_2$模型在大小为4500的集合上进行测试,错误率$e_2=0.28$;
当测试集足够大时,可认为:
为了比较两个模型的性能是否有显著的统计学上的差异,令$d=e_1-e_2$,因为$e_1\sim N,e_2\sim N$,所以,$d\sim N(d_t,\sigma_t)$,由正态分布的性质:
当置信水平为0.95时,$Z_\frac{\alpha}{2}=1.96$:
区间中不包含0,认为两者之间有差距,模型$M_1$的性能优于模型$M_2$的性能。
第五题
在机器学习建模过程中,通行的做法通常是将数据分为训练集和测试集。测试集是与训练独立的数据,完全不参与训练,用于最终模型的评估。在训练过程中,经常会出现过拟合的问题,就是模型可以很好的匹配训练数据,却不能很好在预测训练集外的数据。如果此时就使用测试数据来调整模型参数,就相当于在训练时已知部分测试数据的信息,会影响最终评估结果的准确性。通常的做法是在训练数据再中分出一部分做为验证(Validation)数据,用来评估模型的训练效果。
验证数据取自训练数据,但不参与训练,这样可以相对客观的评估模型对于训练集之外数据的匹配程度。模型在验证数据中的评估常用的是交叉验证,又称循环验证。它将原始数据分成K组(K-Fold),将每个子集数据分别做一次验证集,其余的K-1组子集数据作为训练集,这样会得到K个模型。这K个模型分别在验证集中评估结果,最后的误差MSE(Mean Squared Error)加和平均就得到交叉验证误差。交叉验证有效利用了有限的数据,并且评估结果能够尽可能接近模型在测试集上的表现,可以做为模型优化的指标使用。
import numpy as np
from sklearn.model_selection import KFold
import random

#随机生成一百个(-20,20)的数字
num=[]
for i in range(100):
    num.append(random.randint(-20,20))
#print(num)
#使用k-fold方法对数据集进行划分
num=np.array(num)
kf=KFold(n_splits=6)
for train,test in kf.split(num):
    num_train,num_test=num[train],num[test]

    print("训练集为:",num_train)
    print("验证集为:",num_test)